HELP DOCUMENTATION
A simple user guide
Accessing the Map
Search around an address
You can search around addresses right on the home page. Perhaps you want to go right to your child’s school address or the address of the property you are looking to purchase. You can do that quickly, from here (fig. 3).

Jump to an agency
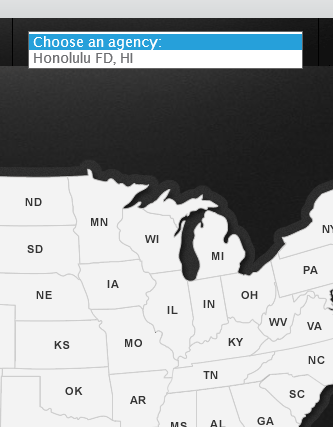
Pick an agency from this list (fig. 1) and you’re taken right to a predetermined area for that agency. Additionally, the calendar is adjusted to the last day of imported incident data for that agency.
Jump to a state
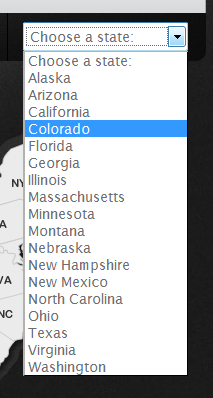
If you are not sure if your city reports data to ResponseMapping.com pick the state you live in, from the list on the home page (fig. 2), for a high-level look at areas of coverage.
LINK TO AN ADDRESS, AGENCY OR STATE
In addition to these methods you can link from any other web page directly back to ResponseMapping.com to perform the same functions, here’s how you do it:
Link to an address
Append the following to the url https://www.responsemapping.com
"/Map/Find/<Search address>"
Example for 1701 Lanakila Ave, Honolulu, HI 96817:
https://www.responsemapping.com/Map/Find/1701 Lanakila Ave, Honolulu, HI 96817
Link to a state*
Append the following to the url https://www.responsemapping.com
"/Map/<Two Letter State Abbreviation>"
Example for Hawaii: https://www.responsemapping.com/Map/HI
Link to an agency*
Append the following to the url https://www.responsemapping.com
"/Map/<Two Letter State Abbreviation>/<Agency Name>"
Example for Honolulu, Hawaii: https://www.responsemapping.com/Map/HI/Honolulu
Using the Map
Drag Zoom (In/Out)
The Drag Zoom tool allows you to draw a rectangle on the map and zoom to (or out from) the area inside that rectangle. This is how it works:
- Click the Drag Zoom In, or Out button (fig. 4) and your cursor becomes a set of cross-hairs.
- Click the map and drag a rectangle over the area to which you want to zoom.
- A rectangle will follow your mouse and as soon as you release the mouse, you will zoom in or out to that
area and the Drag Zoom tool will no longer be active.

Change symbol sizes
For your convenience we’ve provided two different symbol sets for viewing incidents. If you have a
large screen resolution or a limited screen size, you can swap easily between large and miniature icons. Here's how it works:
- Jump to a city with incidents.
- Click the Use Mini Icons button (fig. 6).
- The map symbology will switch to smaller icons.
- Click the Use Large Icons button to revert to the large icons.

Choose different incident types
To focus your query or search for a particular incident that you might have seen; you can turn on or off
the incident types that are displayed on the map. Here's how it works:
- Jump to a city with incidents.
- Click the Incident Types tab (fig. 7).
- Click a check box underneath one of the incident types turn on or off that incident type on the map.

Change the date range
To search for incidents from last week, or even last month, you can adjust the visible date range by
clicking the date tab and choosing different dates (fig. 8a).

Here's how it works:
- Jump to a city with incidents.
- Click the Date tab, between the Incident Types tab (fig. 7), and the Buffered Address tab (fig. 9b).
- Click the text box labeled FROM: to set your start date.
- Click the text box labeled TO: to set your end date.
- NOTE: When selecting dates you may not select a TO: date in the future and you may not select a FROM: date that comes after the TO: date. Conversely you may not select a TO: date that comes before your selected FROM: date. The calendar will not allow it.
- The set of available dates will roll from today back 180 days. Dates outside of that range are not selectable on the calendar.
Search near an address
To focus your search for incidents around a particular location, you must do two things. Here's how it works:
- SEARCH FOR AN ADDRESS
- In the address bar above the tabs (fig. 9a) type an address and click “Search” (Or press Enter). That address will be marked on the map and an information window will automatically appear over it.
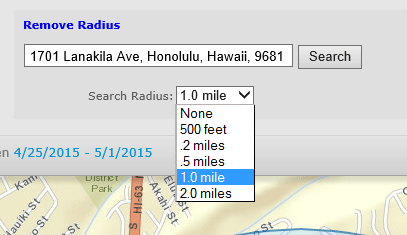
- Alternatively, you can arrive at this point in the process from the home page, or you can enter an address from the Buffered Address tab (fig. 9b) and click “Search” (Or press Enter).
- FOCUS YOUR SEARCH AROUND THAT ADDRESS
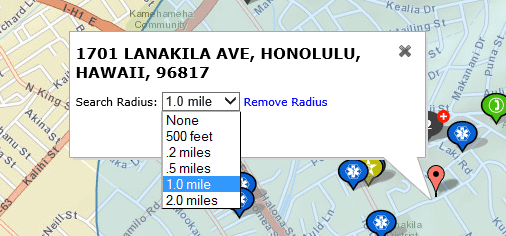
- In the information window that pops up over your address point, choose a distance from the drop down list that appears within. (fig. 9c).
- Once you’ve chosen a distance the incidents outside of that area drop off the map and you will only see the incidents within that focused area.
- Alternatively, you can choose a distance from the Buffered Address tab (fig. 9b) by selecting a distance from the same list next to the “Search” button (fig. 9d).
- Subscribing to the Incident Alerts feature allows you to focus your search around an address as well. In order to change the search distance after you have
registered for Incident Alerts you must unsubscribe and then subscribe again using a different buffer distance during Step 3 of the process (fig. 9e).
The unsubscribe link can be found at the bottom of each Incident Alert e-mail.
- Finally, you can remove the focused area by clicking the Clear Buffer button below the Use Mini Icons button (fig. 9f) or by clicking the Clear Buffer button next to the distance list (fig. 9g) in the Buffered Address tab.




Filter by an agency
To view only the incidents for a specific agency, select that agency from the list directly below the agencies tab (fig. 10)
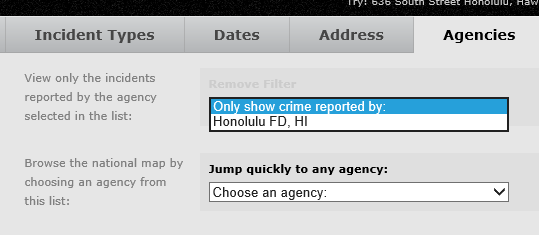
After you choose an agency from the list, you may remove the filter by clicking "Remove Filter" above the drop down list (fig. 10a) or by clicking the "Remove Filter" button from the map tools (fig. 10b).


Jump to other agencies
You can browse around the map quickly by jumping to different agencies in the list under the Agencies tab. (fig. 11)
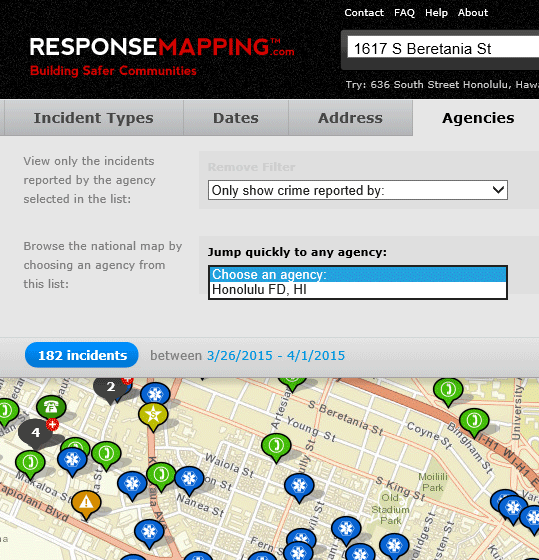
Note: If you jump quickly to an agency whose date range is different from the one you were currently viewing you may need to adjust the visible date range.
Find the distance between an address and an incident
You may recognize an incident on the map and want to know how far away it is from a certain location. You can get that information very easily.
- Jump to a city with incidents.
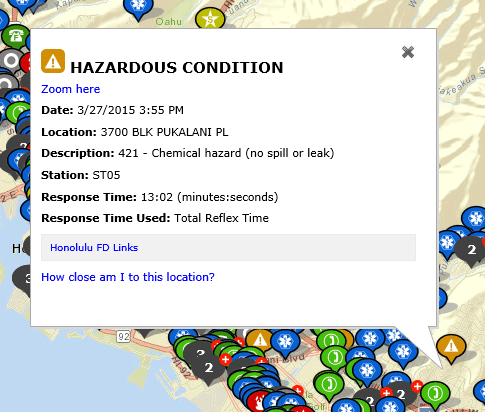
- Click an individual incident on the map and an information window will open over the incident (fig. 11a).
- Click the link that reads, “How close am I to this location?” and the information window will show an address search box beneath the link.
- Enter an address in the box and click “Go.”
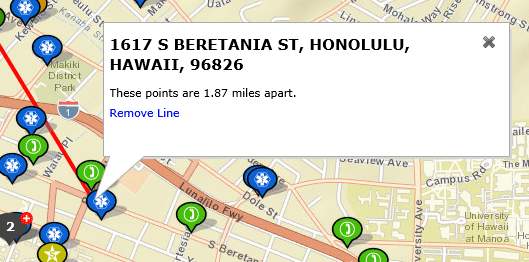
- The distance between those two points is displayed in a green bubble beneath the address search box.
- Click the link that reads “Clear” (fig. 11b) to remove the form and clear the lines from the map.
- Alternatively, you may click the Clear Lines button that is below the Use Mini Icons button (fig. 11c). Closing the information window will also clear the line from the map.

Send link
You can share any map you make with a friend by clicking the send a link button. This button opens a new window to the send link form.
- Click the Send Link button (fig. 12a).
- A new window with the form opens* (fig. 12b).

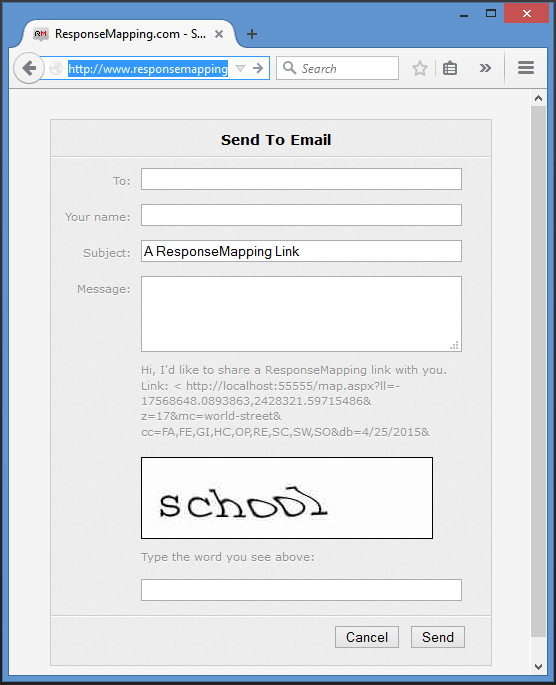
Copy link
You can also share any map you make with a friend by clicking the copy link button. Copy and paste this link anywhere you like. This button opens a dialog with the link pre-selected.
- Click the Copy Link button (fig. 13a).
- A new window with the form opens* (fig. 13b).


Create a trend report
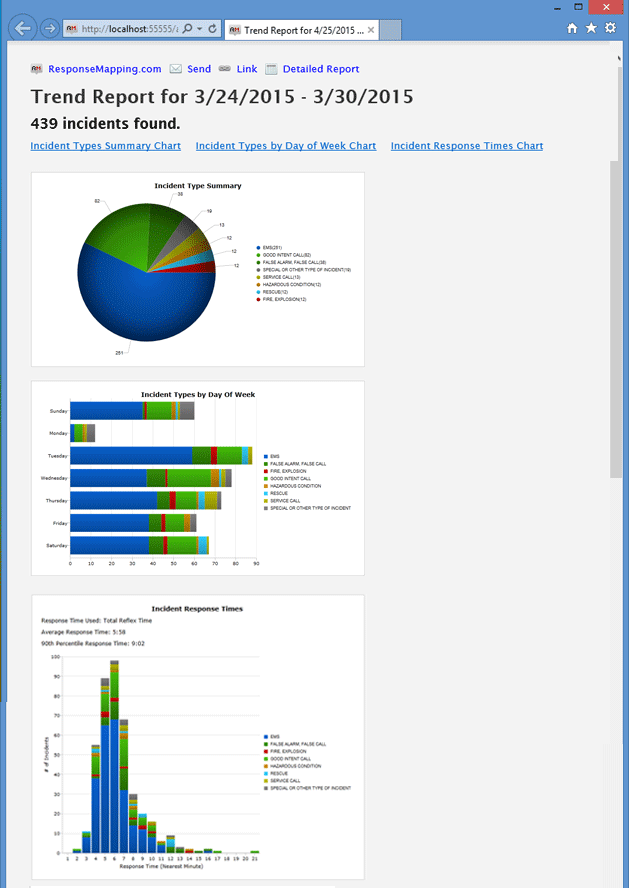
If at any point while using the map to find incidents you want to see a detailed listing, follow the directions below.
- Jump to a city with incidents.
- Click the Trend Report button (fig. 14a).
- A new window with the trends will open* (fig. 14b).

Create a detailed report
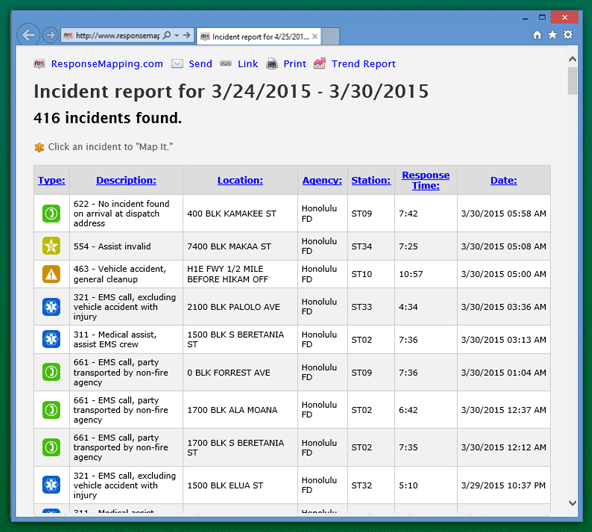
If at any point while using the map to find incidents you want to see a detailed listing, follow the directions below.. Here's how it works:
- Jump to a city with incidents.
- Click the link that reads “Generate Report” (fig. 15a).
- A new window with your detailed list will open* (fig. 15b).
- Click on a column label in the detailed list to sort the table by that column.
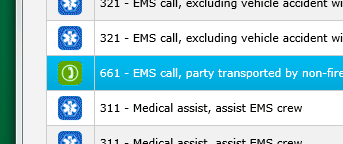
- Click on an incident in the detailed list and you will zoom to that incident on the map (fig. 15c).

Printing
Sometimes you may want to print a copy of the visible map and you can do that very easily right from the map itself. Here's how you do it:
- Jump to a city with incidents.
- Click the link that reads “Print this Map” (fig. 16a).
- A new window with the same map will open* showing your incidents and a simple summary of the query including any specific location around which the incident occurred as well as dates and selected incident type information.
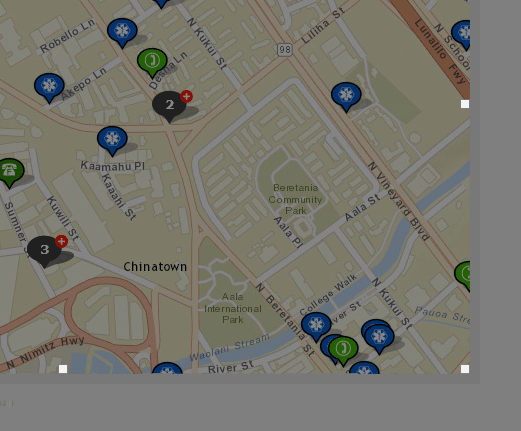
- You can drag the printed map area around to compose your image in a way that is pleasing to you and you can even expand the size of the printed map area on the fly by grabbing the small squares at the bottom and right side of the printed map (fig. 16b).
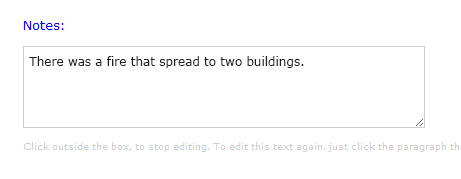
- Finally, you can add a few notes to your printed page by clicking the link that reads “Notes:” and entering the information in the text box that appears (fig. 16c). Click outside the text box to set your notes into place (fig. 16d) and click the typed notes again to edit them (fig. 16c).
* You need to enable popup windows for this website.

General Symbology
Here is some information about the markers and symbols you might find on the map
Agencies
Each agency has its own marker on the map, represented by a red marker.
Incidents
Every incident has a symbol associated with it, and depending on your preference you can use a tiny icon, or a larger icon.
 |
 |
| Large Icons |
Mini Icons |
Legend
A common reporting format for fire departments and EMS agencies is the National Fire Incident Reporting System (NFIRS). For ResponseMapping.com we leverage this reporting format for determining incident types. In order to remain consistent for all the public safety incident data we collect and reduce the number of different Incident Types that we manage, we map our client's Incident Types to the following major categories using the following symbols:
-

 Fire Explosion
Includes fires out on arrival and gas vapor explosions (with extremely rapid combustion), structure fires, vehicle fires, rubbish fires, natural vegetation fires and crop fires.
-

 Overpressure Rupture
Includes overpressure rupture, explosion and overheat (no fire), excluding steam mistaken for smoke.
-

 EMS
EMS
Emergency medical incident, including treatment and transport of a person in a health crisis situation.
-

 Rescue
Rescue incident, including search for lost person, extrication rescue, water and ice related rescue, electrical rescue, and lock-in.
-

 Hazardous Condition
Includes combustible/flammable spills and leaks (no fire), chemical release, reaction, or toxic condition, radioactive condition, electrical wiring/equipment problem, biological hazard and explosive or bomb removal.
-

 Service Call
Incudes person in distress, water problem, smoke or odor problem, animal problem or rescue, public service assistance, unauthorized burning, cover assignment, standby at fire station and move-up.
-

 Good Intent Call
Includes units dispatched and canceled enroute, wrong location or no emergency found, controlled burning, vicinity alarm, steam or other gas mistaken for smoke, EMS call where party has been transported and HazMat release investigation with no HazMat found.
-

 False Alarm False Call
Includes malicious, mischievous false alarm, bomb scare, system or detector malfunction, Unintentional system or detector operation (no fire) and biohazard scare.
-

 Severe Weather
Includes earthquake assessment, no rescue or other service rendered, flood assessment (excluding water rescue), wind storm, tornado, hurricane, or cyclone assessment (no other service rendered) and lightning strike (no fire).
-

 Other Incident Type
Includes citizen complaint or other type of incident not associated to other defined incident types.
-

 Multiple incidents at one location
This symbol represents multiple incidents at the exact same location. Clicking on the incident will bring up a page-by-page list of the incidents.